ABC CORDOBA 26-03-2012 página 37
- EdiciónABC, CORDOBA
- Página37
- Fecha de publicación26/03/2012
- ID0006100706
Ver también:

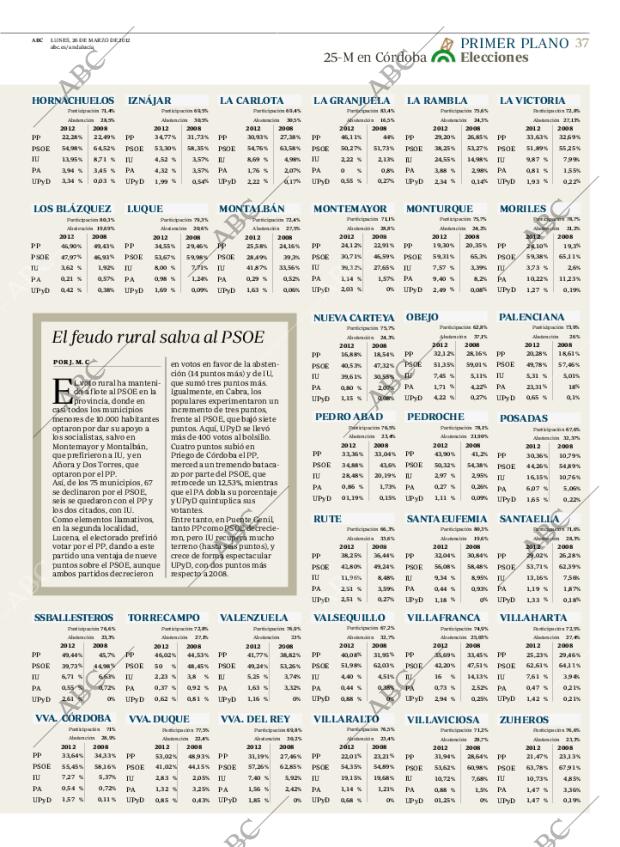
ABC LUNES, 26 DE MARZO DE 2012 abc. es andalucía 25- M en Córdoba LA CARLOTA Participación 69,4 Abstención PRIMER PLANO 37 Elecciones HORNACHUELOS Participación 71,4 Abstención IZNÁJAR Participación 69,5 Abstención LA GRANJUELA Participación 83,4 Abstención LA RAMBLA Participación 75,6 Abstención LA VICTORIA Participación 72,8 Abstención 27,13 28,5 30,5 30,5 16,5 24,3 PP PSOE IU PA UPyD 2012 22,28 %54,98 %13,95 %3,94 %3,34 2008 22,49 %64,52 %8,71 %3,45 %0,03 PP PSOE IU PA UPyD 2012 34,77 %53,30 %4,52 %4,32 %1,99 2008 31,73 %58,35 %3,57 %3,57 %0,54 PP PSOE IU PA UPyD 2012 30,93 %54,76 %8,69 %1,76 %2,22 2008 27,38 %63,58 %4,98 %2,07 %0,17 PP PSOE IU PA UPyD 2012 46,11 %50,27 %2,22 %0 2008 44 %51,73 %2,13 %0,8 %0,27 PP PSOE IU PA UPyD 2012 29,20 %38,25 %24,55 %3,88 %2,34 2008 26,85 %53,27 %14,98 %2,98 %0,14 PP PSOE IU PA UPyD 2012 33,63 %51,89 %9,87 %0,81 %1,93 2008 32,69 %55,25 %7,99 %1,55 %0,22 0,55 LOS BLÁZQUEZ Participación 80,3 Abstención 19,69 LUQUE Participación 79,3 Abstención MONTALBÁN Participación 72,4 Abstención MONTEMAYOR Participación 71,1 Abstención MONTURQUE Participación 75,7 Abstención MORILES Participación 78,7 Abstención 20,6 27,5 28,8 24,2 21,2 PP PSOE IU PA UPyD 2012 46,90 %47,97 %3,62 %0,21 %0,42 2008 49,43 %46,93 %1,92 %0,57 %0,38 PP PSOE IU PA UPyD 2012 34,55 %53,67 %8,00 %0,98 %1,69 2008 29,46 %59,98 %7,71 %1,24 %0,09 PP PSOE IU PA UPyD 2012 25,58 %28,49 %41,87 %0,29 %1,63 2008 24,16 %39,3 %33,56 %0,52 %0,06 PP PSOE IU PA UPyD 2012 24,12 %30,71 %39,32 %1,14 %2,03 2008 22,91 %46,59 %27,65 %1,57 %0 PP PSOE IU PA UPyD 2012 19,30 %59,31 %7,57 %9,40 %2,49 2008 20,35 %65,3 %3,39 %8,2 %0,08 PP PSOE IU PA UPyD 2012 24,10 %59,38 %3,73 %10,22 %1,27 2008 19,3 %65,11 %2,6 %11,23 %0,19 NUEVA CARTEYA OBEJO Participación 62,8 Abstención PALENCIANA Participación 73,9 Abstención El feudo rural salva al PSOE POR J. M. C Participación 75,7 Abstención 24,3 37,1 26 E L voto rural ha mantenido a flote al PSOE en la provincia, donde en casi todos los municipios menores de 10.000 habitantes optaron por dar su apoyo a los socialistas, salvo en Montemayor y Montalbán, que prefirieron a IU, y en Añora y Dos Torres, que optaron por el PP. Así, de los 75 municipios, 67 se declinaron por el PSOE, seis se quedaron con el PP y los dos citados, con IU. Como elementos llamativos, en la segunda localidad, Lucena, el electorado prefirió votar por el PP, dando a este partido una ventaja de nueve puntos sobre el PSOE, aunque ambos partidos decrecieron en votos en favor de la abstención (14 puntos más) y de IU, que sumó tres puntos más. Igualmente, en Cabra, los populares experimentaron un incremento de tres puntos, frente al PSOE, que bajó siete puntos. Aquí, UPyD se llevó más de 400 votos al bolsillo. Cuatro puntos subió en Priego de Córdoba el PP, merced a un tremendo batacazo por parte del PSOE, que retrocede un 12,53 mientras que el PA dobla su porcentaje y UPyD quintuplica sus votantes. Entre tanto, en Puente Genil, tanto PP como PSOE decrecieron, pero IU recupera mucho terreno (hasta seis puntos) y crece de forma espectacular UPyD, con dos puntos más respecto a 2008. PP PSOE IU PA UPyD 2012 16,88 %40,53 %39,61 %0,80 %1,15 2008 18,54 %47,32 %30,55 %2,07 %0,08 PP PSOE IU PA UPyD 2012 32,12 %51,35 %7,45 %1,71 %4,22 2008 28,16 %59,01 %5,11 %4,22 %0,27 PP PSOE IU PA UPyD 2012 20,28 %49,78 %5,31 %23,31 %0,65 2008 18,61 %57,46 %5,01 %18 %0,1 PEDRO ABAD Participación 76,5 Abstención PEDROCHE Participación 78,1 Abstención 21,90 POSADAS Participación 67,6 Abstención 32,37 23,4 PP PSOE IU PA UPyD 2012 33,36 %34,88 %28,48 %0,86 %01,19 2008 33,04 %43,6 %20,19 %1,73 %0,15 PP PSOE IU PA UPyD 2012 43,90 %50,32 %2,97 %0,27 %1,11 2008 41,2 %54,38 %2,95 %0,26 %0,09 PP PSOE IU PA UPyD 2012 30,36 %44,26 %16,15 %6,07 %1,65 2008 10,79 %54,89 %10,76 %5,06 %0,22 RUTE Participación 66,3 Abstención SANTA EUFEMIA Participación 80,3 Abstención SANTAELLA Participación 71,6 Abstención 33,6 19,6 28,3 PP PSOE IU PA UPyD 2012 38,25 %42,80 %11,96 %2,51 %2,51 2008 36,44 %49,24 %8,48 %3,59 %0,27 PP PSOE IU PA UPyD 2012 32,04 %56,08 %9,34 %0,44 %1,18 2008 30,84 %58,48 %8,95 %0,93 %0 PP PSOE IU PA UPyD 2012 29,02 %53,71 %13,16 %1,19 %1,33 2008 26,28 %62,39 %7,56 %1,87 %0,18 SSBALLESTEROS Participación 76,6 Abstención TORRECAMPO Participación 72,8 Abstención VALENZUELA Participación 76,9 Abstención VALSEQUILLO Participación 67,2 Abstención VILLAFRANCA Participación 74,9 Abstención 25,03 VILLAHARTA Participación 72,5 Abstención 23,3 27,1 23 32,7 27,4 PP PSOE IU PA UPyD 2012 49,44 %39,73 %6,71 %0,55 %2,61 2008 45,7 %44,98 %6,63 %0,72 %0 PP PSOE IU PA UPyD 2012 46,02 %50 2008 44,53 %48,45 %3,8 PP PSOE IU PA UPyD 2012 41,77 %49,24 %5,25 %1,63 %1,16 2008 38,82 %53,26 %3,74 %3,32 %0 PP PSOE IU PA UPyD 2012 40,08 %51,98 %4,40 %0,44 %0,88 2008 31,95 %62,03 %4,51 %0,38 %0 PP PSOE IU PA UPyD 2012 35,69 %42,20 %16 2008 33,45 %47,51 %14,13 %2,52 %0,25 PP PSOE IU PA UPyD 2012 25,23 %62,61 %7,61 %0,47 %1,42 2008 29,46 %64,11 %3,94 %0,21 %0,21 2,23 %0,37 %0,62 0,92 %0,81 0,73 %2,94 VVA. CÓRDOBA Participación Abstención 71 %28,9 VVA. DUQUE Participación 77,5 Abstención VVA. DEL REY Participación 69,8 Abstención VILLARALTO Participación 76,5 Abstención VILLAVICIOSA Participación 71,2 Abstención ZUHEROS Participación 76,6 Abstención 22,4 30,2 23,4 PP PSOE IU PA UPyD 2012 33,64 %55,45 %7,27 %0,54 %1,57 2008 34,33 %58,16 %5,37 %0,72 %0,11 PP PSOE IU PA UPyD 2012 53,02 %41,02 %2,83 %1,32 %0,85 2008 48,93 %44,15 %2,05 %3,25 %0,43 PP PSOE IU PA UPyD 2012 31,19 %57,26 %7,40 %1,56 %1,85 2008 27,46 %62,85 %5,92 %2,42 %0 PP PSOE IU PA UPyD 2012 22,01 %54,35 %19,15 %1,14 %0,68 2008 23,21 %54,89 %19,68 %1,21 %0 28,7 23,3 PP PSOE IU PA UPyD 2012 31,94 %53,62 %10,72 %0,88 %01,25 2008 28,64 %60,98 %7,68 %1,5 %0 PP PSOE IU PA UPyD 2012 21,47 %63,78 %10,73 %1,47 %1,47 2008 23,13 %67,91 %4,85 %3,36 %0,19
 Foto24/05/2001
 Monográfico14/03/2021
 Periódico31/10/2004